
IMPROVETEAM · DELIVERY INTELLIGENCE
Understand what your technology organization delivers.
ImproveTeam connects business work to engineering activity and delivery outcomes, giving technology leaders a clearer view of team performance, initiative progress and the patterns behind them.
IMPROVETEAM · TEAM PERFORMANCE
Back to overview ↑See speed, output and quality together.
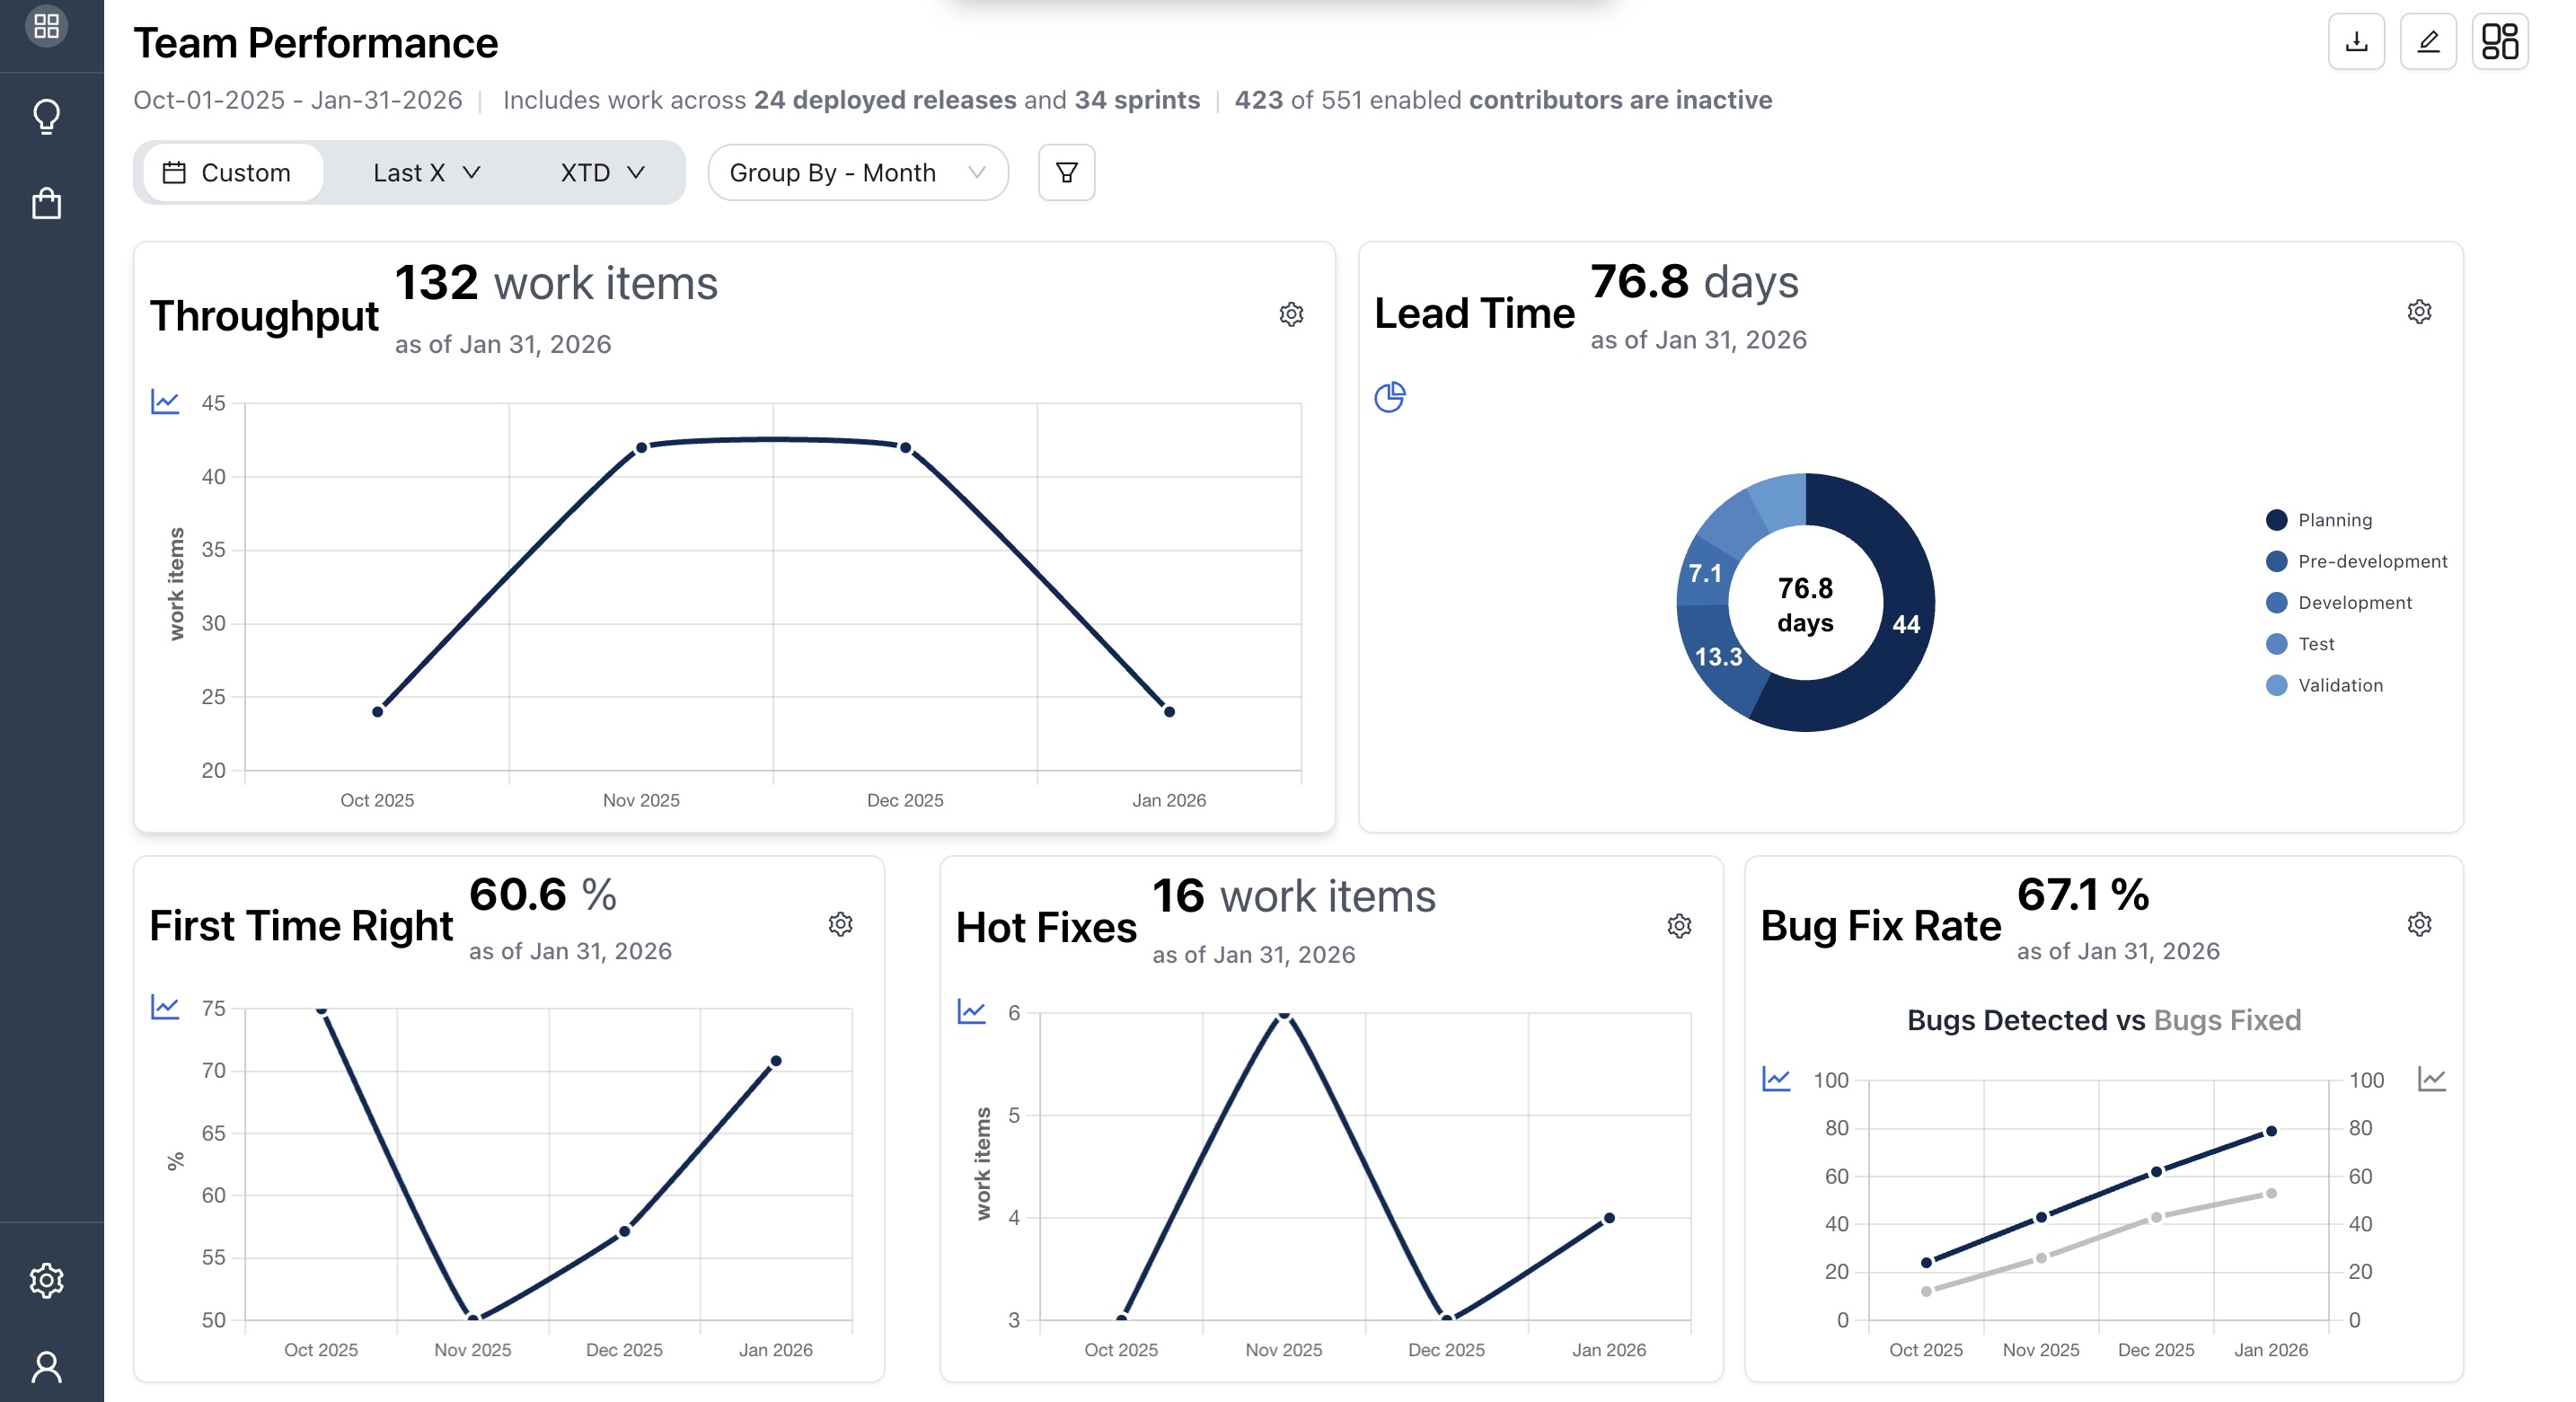
Understand how technology teams are performing by looking at delivery throughput, lead time and quality measures together. Explore differences across teams and time periods to understand where performance is strong and where further investigation may be warranted.
- Delivery throughput
- Understand how much work teams complete over a given period.
- Lead time
- Explore how long work takes to move through delivery.
- Delivery quality
- Assess production stability through the net change in product defects and the frequency of unplanned hot-fix releases.
First Time Right
— Measures how often an initial PR merge reaches production without requiring another PR merge from the same feature branch.A cross-cutting measure of delivery effectiveness
IMPROVETEAM · ENGINEERING PARTICIPATION
Back to overview ↑Understand who — and what — is doing the work.
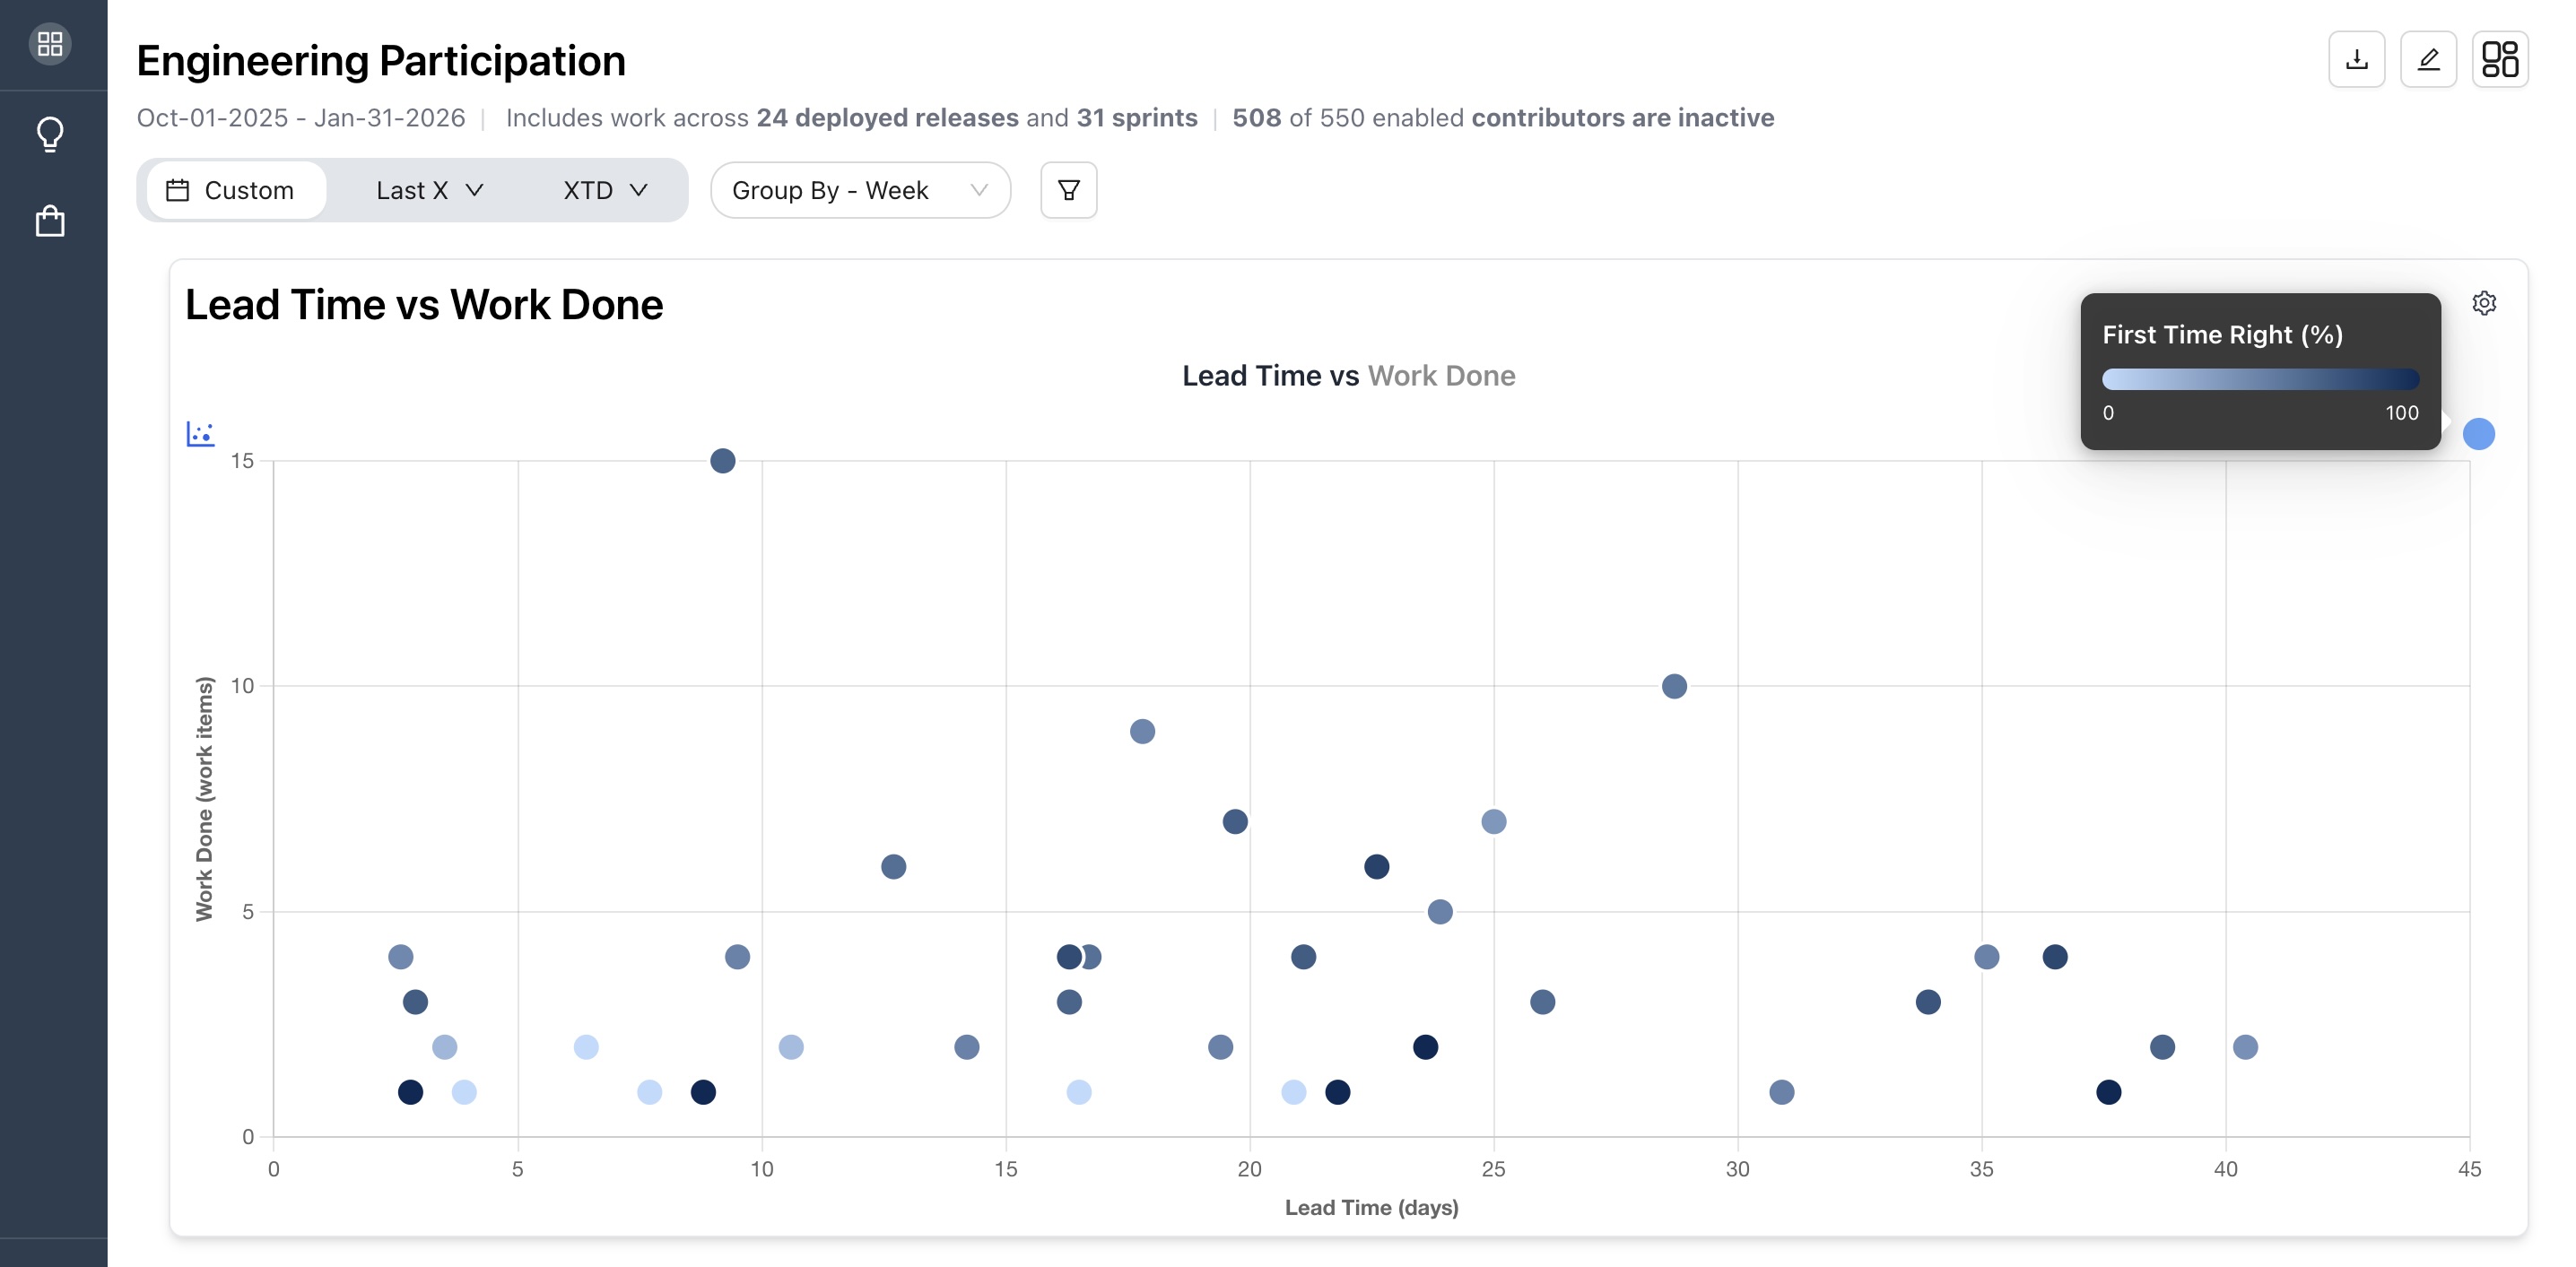
Understand how work is distributed across your technology workforce, including people and digital workers such as AI agents. Identify unusual participation patterns, explore their context, and investigate how different forms of contribution relate to delivery outcomes.
- Participation patterns
- Understand how work is distributed across human and digital workers over a given period. Identify unusual patterns that warrant further investigation.
- Contribution and outcomes
- Explore how participation patterns relate to work completed, lead time and delivery quality. Where attribution data supports it, distinguish contributions from people, AI agents and combined human–agent workflows.
- Context matters
- Use the data to ask better questions, not jump to conclusions. An unusual pattern may reflect different responsibilities, leave, work that is not captured by the available integrations, or a genuine delivery constraint.
One delivery workforce
— People and digital workers, including AI agents, contribute to the same delivery work.Where agent-level attribution is partial, ImproveTeam helps leaders understand the data that is available.
IMPROVETEAM · INITIATIVE PROGRESS
Back to overview ↑See initiative progress without chasing updates.
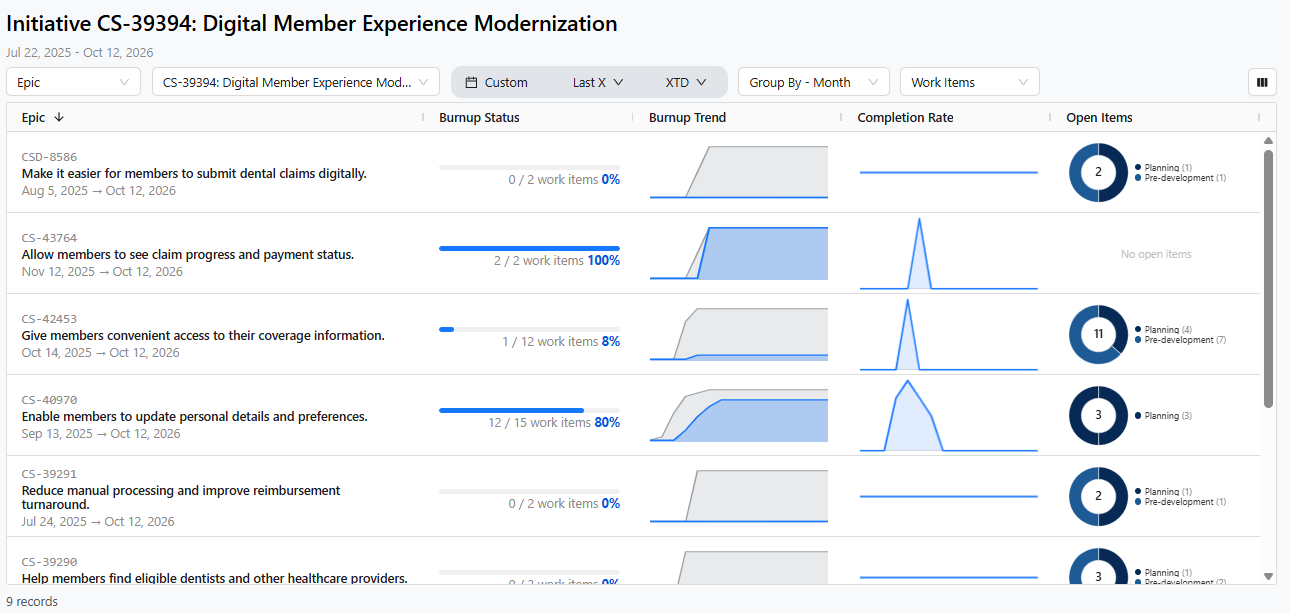
Get a current view of the work behind a business initiative. ImproveTeam brings together the progress of underlying work items, such as epics and stories, so leaders can understand what is moving, what remains, and where further attention may be needed—without relying on manually assembled status reports.
- Current initiative status
- See the progress of the work items associated with a business initiative, using the delivery data available from the underlying systems.
- Progress at the work-item level
- Look beyond a high-level status label to understand how the constituent epics, stories and other tracked work items are progressing.
- Less manual status reporting
- Reduce the need to chase teams for updates and manually consolidate reports. Use the available delivery data to establish a more current view of progress.
From status collection to delivery visibility
— Give leaders a more current view of initiative progress from the work itself, rather than relying on manually assembled updates.IMPROVETEAM · WORK-ITEM JOURNEY
Back to overview ↑Trace work from business need to production.
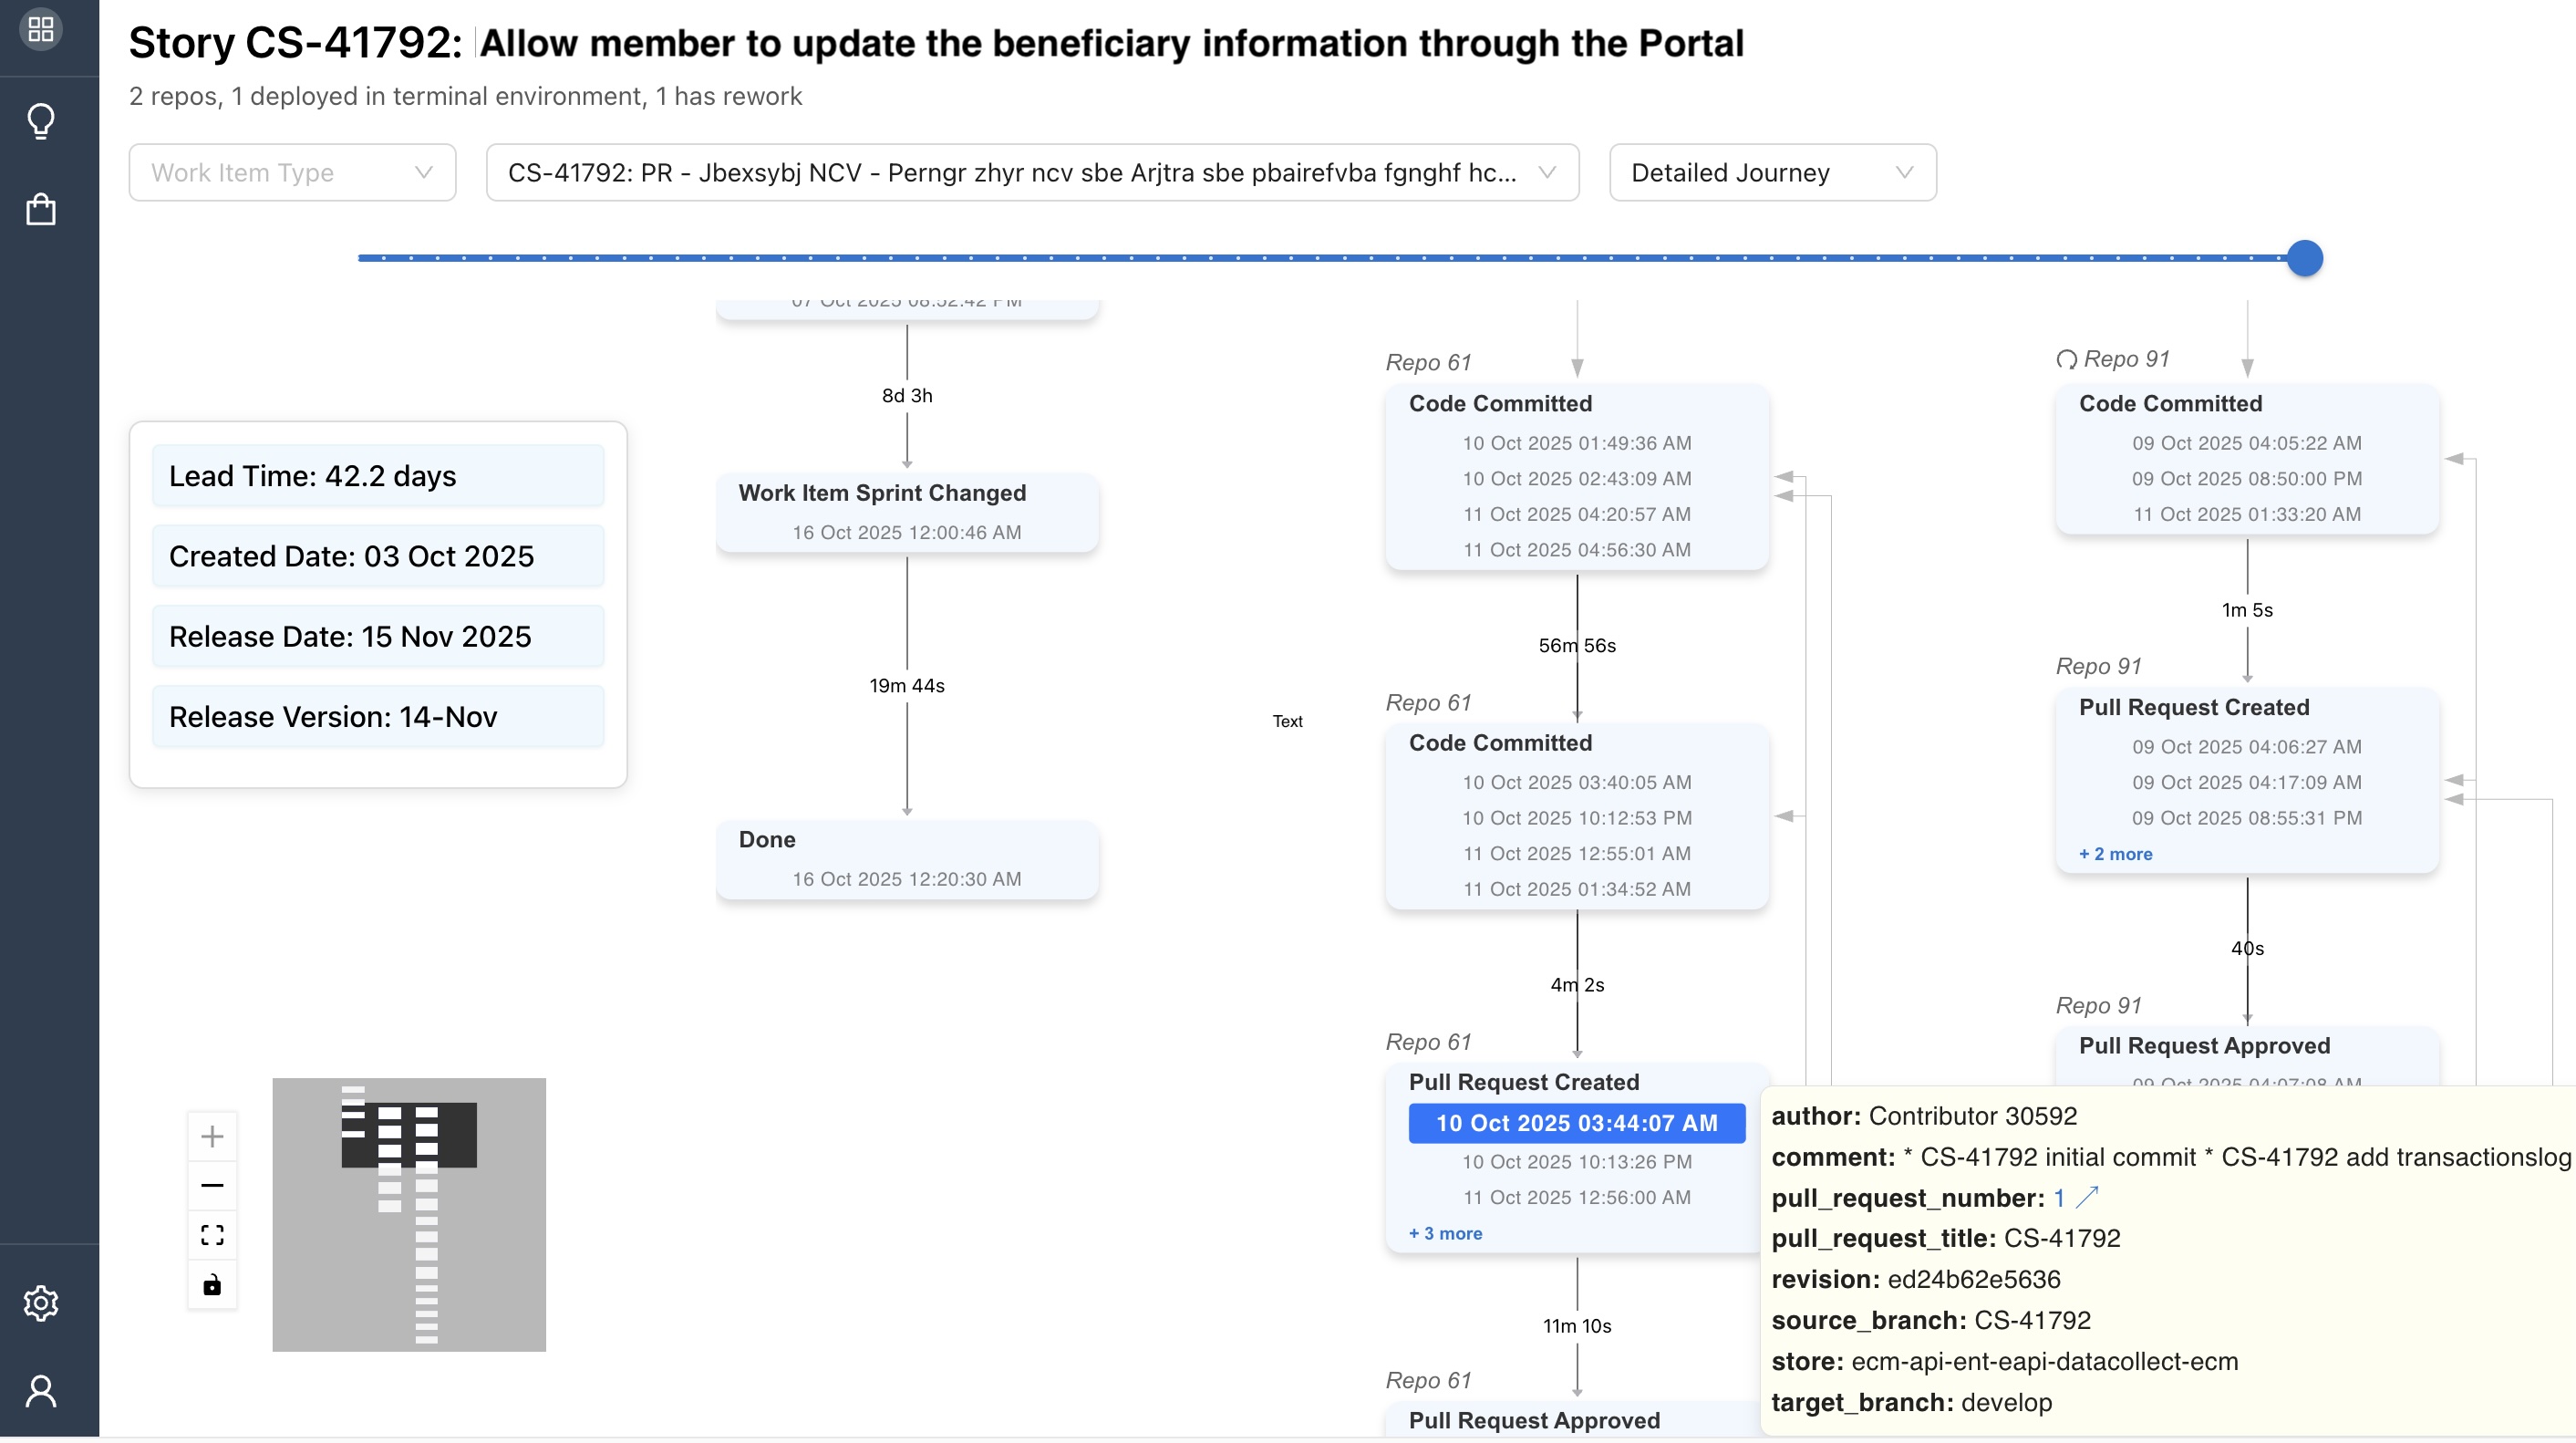
Follow an individual work item through the delivery process. Connect the business work to the associated repositories, code changes, pull requests, validation and production deployment. Understand how the work progressed and where time was spent along the way.
- Trace the delivery path
- Follow a work item through the engineering and delivery systems that record its progress, including associated repositories, code changes and pull requests where available.
- Understand where time was spent
- Explore the time recorded across delivery stages to investigate delays, handoffs or bottlenecks in the journey from business work to production.
- Connect activity to outcomes
- Use the work-item journey to understand how engineering activity relates to delivery progress and production deployment, rather than viewing commits, pull requests and releases as disconnected events.
From disconnected activity to traceable delivery
— Connect the available engineering and delivery evidence to understand how individual work moves from business intent into production.Start measuring delivery
Connect the tools you already use. See value quickly.
ImproveTeam connects to the systems where work is defined, built and deployed — without introducing another workflow for your teams.
- ISO 27001 — Information security
- SOC 2 Type II — Independent controls assurance
- Single sign-on — Enterprise access control
Selected integrations
Work management
Jira · Azure DevOps
Source code
GitLab · GitHub · Bitbucket
CI / CD
Jenkins · GitLab CI/CD · GitHub Actions
ImproveTeam
Meaningful Work → Delivery → Outcomes
Time to value
Value in ~1 week
ImproveTeam is designed to be largely plug-and-play, with minimal change to how teams define and deliver work.
Best results come when meaningful business work is represented as independently shippable stories or increments. This is a measurement prerequisite, not a technical implementation prerequisite.